
|
New Graph, Table and Geomap Features Each version of EViews has always introduced improvements to our powerful graphing and presentation quality output engine, and EViews 12 is no different. Here are some of the improvements we've made to graphs in this version.
SMART SHADING Previously, when adding lines and shades to a frozen graph, EViews prompted you to place the new element using observation indices (“1”, “10”, etc.) or dates and date pairs. EViews 12 adds the ability to specify placement of these elements using sample statements. This feature makes it easy to place objects at irregular elements in dated workfiles, when for example, using if conditions to highlight observations meeting a condition, say high unemployment. Similarly, you may now use predefined sample objects to place shade elements, and commonly employed intervals, when for example shading periods of recession. 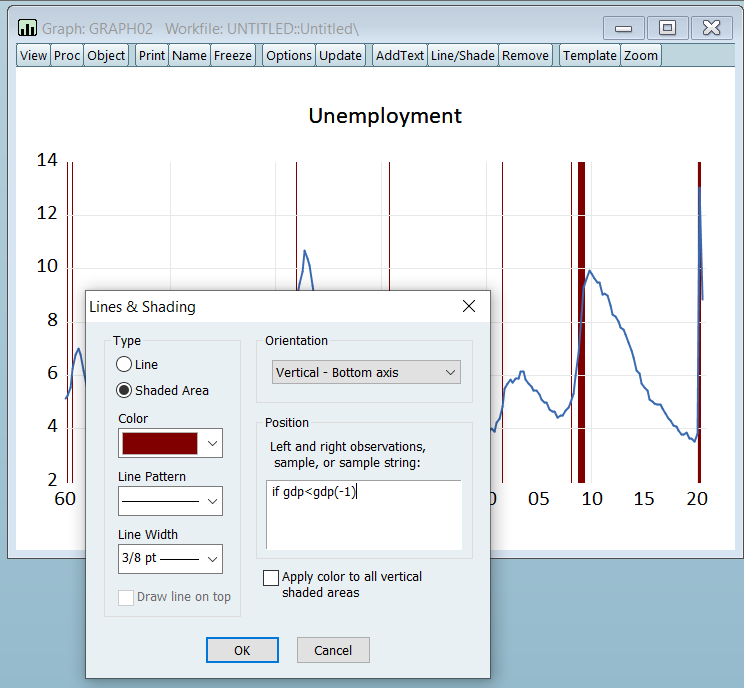 ANIMATED GRAPHS AND GEOMAPS EViews 12 includes new animation tools for both graphs and GeoMaps. Static graphs display data for a fixed range of observations. That range may consist of a single observations or multiple observations, but it does not change. With animated graphs, you can dynamically adjust the range of data and thusly display how the data change over a given interval Animated graphs allow viewers to see how data transition from period to another or alternatively compare the data between periods. EViews 12 features both an in-program animation suite for displaying animated graphs within EViews itself, and tools for outputting animated graphs as either .GIF files or .MPEG files for distribution and presentation in external packages or the web. X-Y ERROR BARS X-Y Error Bars are a graphical representation of the data with standard error bar bands. Prior to EViews 12, the x-axis was tied to the workfile observation IDs.Now in EViews 12, X-Y error bars allow the user to tie the x-axis to specified set of data (or series).  MISCELLANEOUS IMPROVEMENTS EViews 12 also includes miscellaneous other graphing improvements:
IHS Global Inc.是EViews软件的制造商 © 2020 IHS Global Inc. All Rights Reserved.
在线留言尊敬的客户朋友,如您有任何意见建议,请通过下表反馈给我们,我们会尽快与您联系。
|
|
|
||||||||||||||||||||||||

 400-621-1085


